Charts & Infographics OVERVIEW TOOLS
Data Visualization | Graphic Design
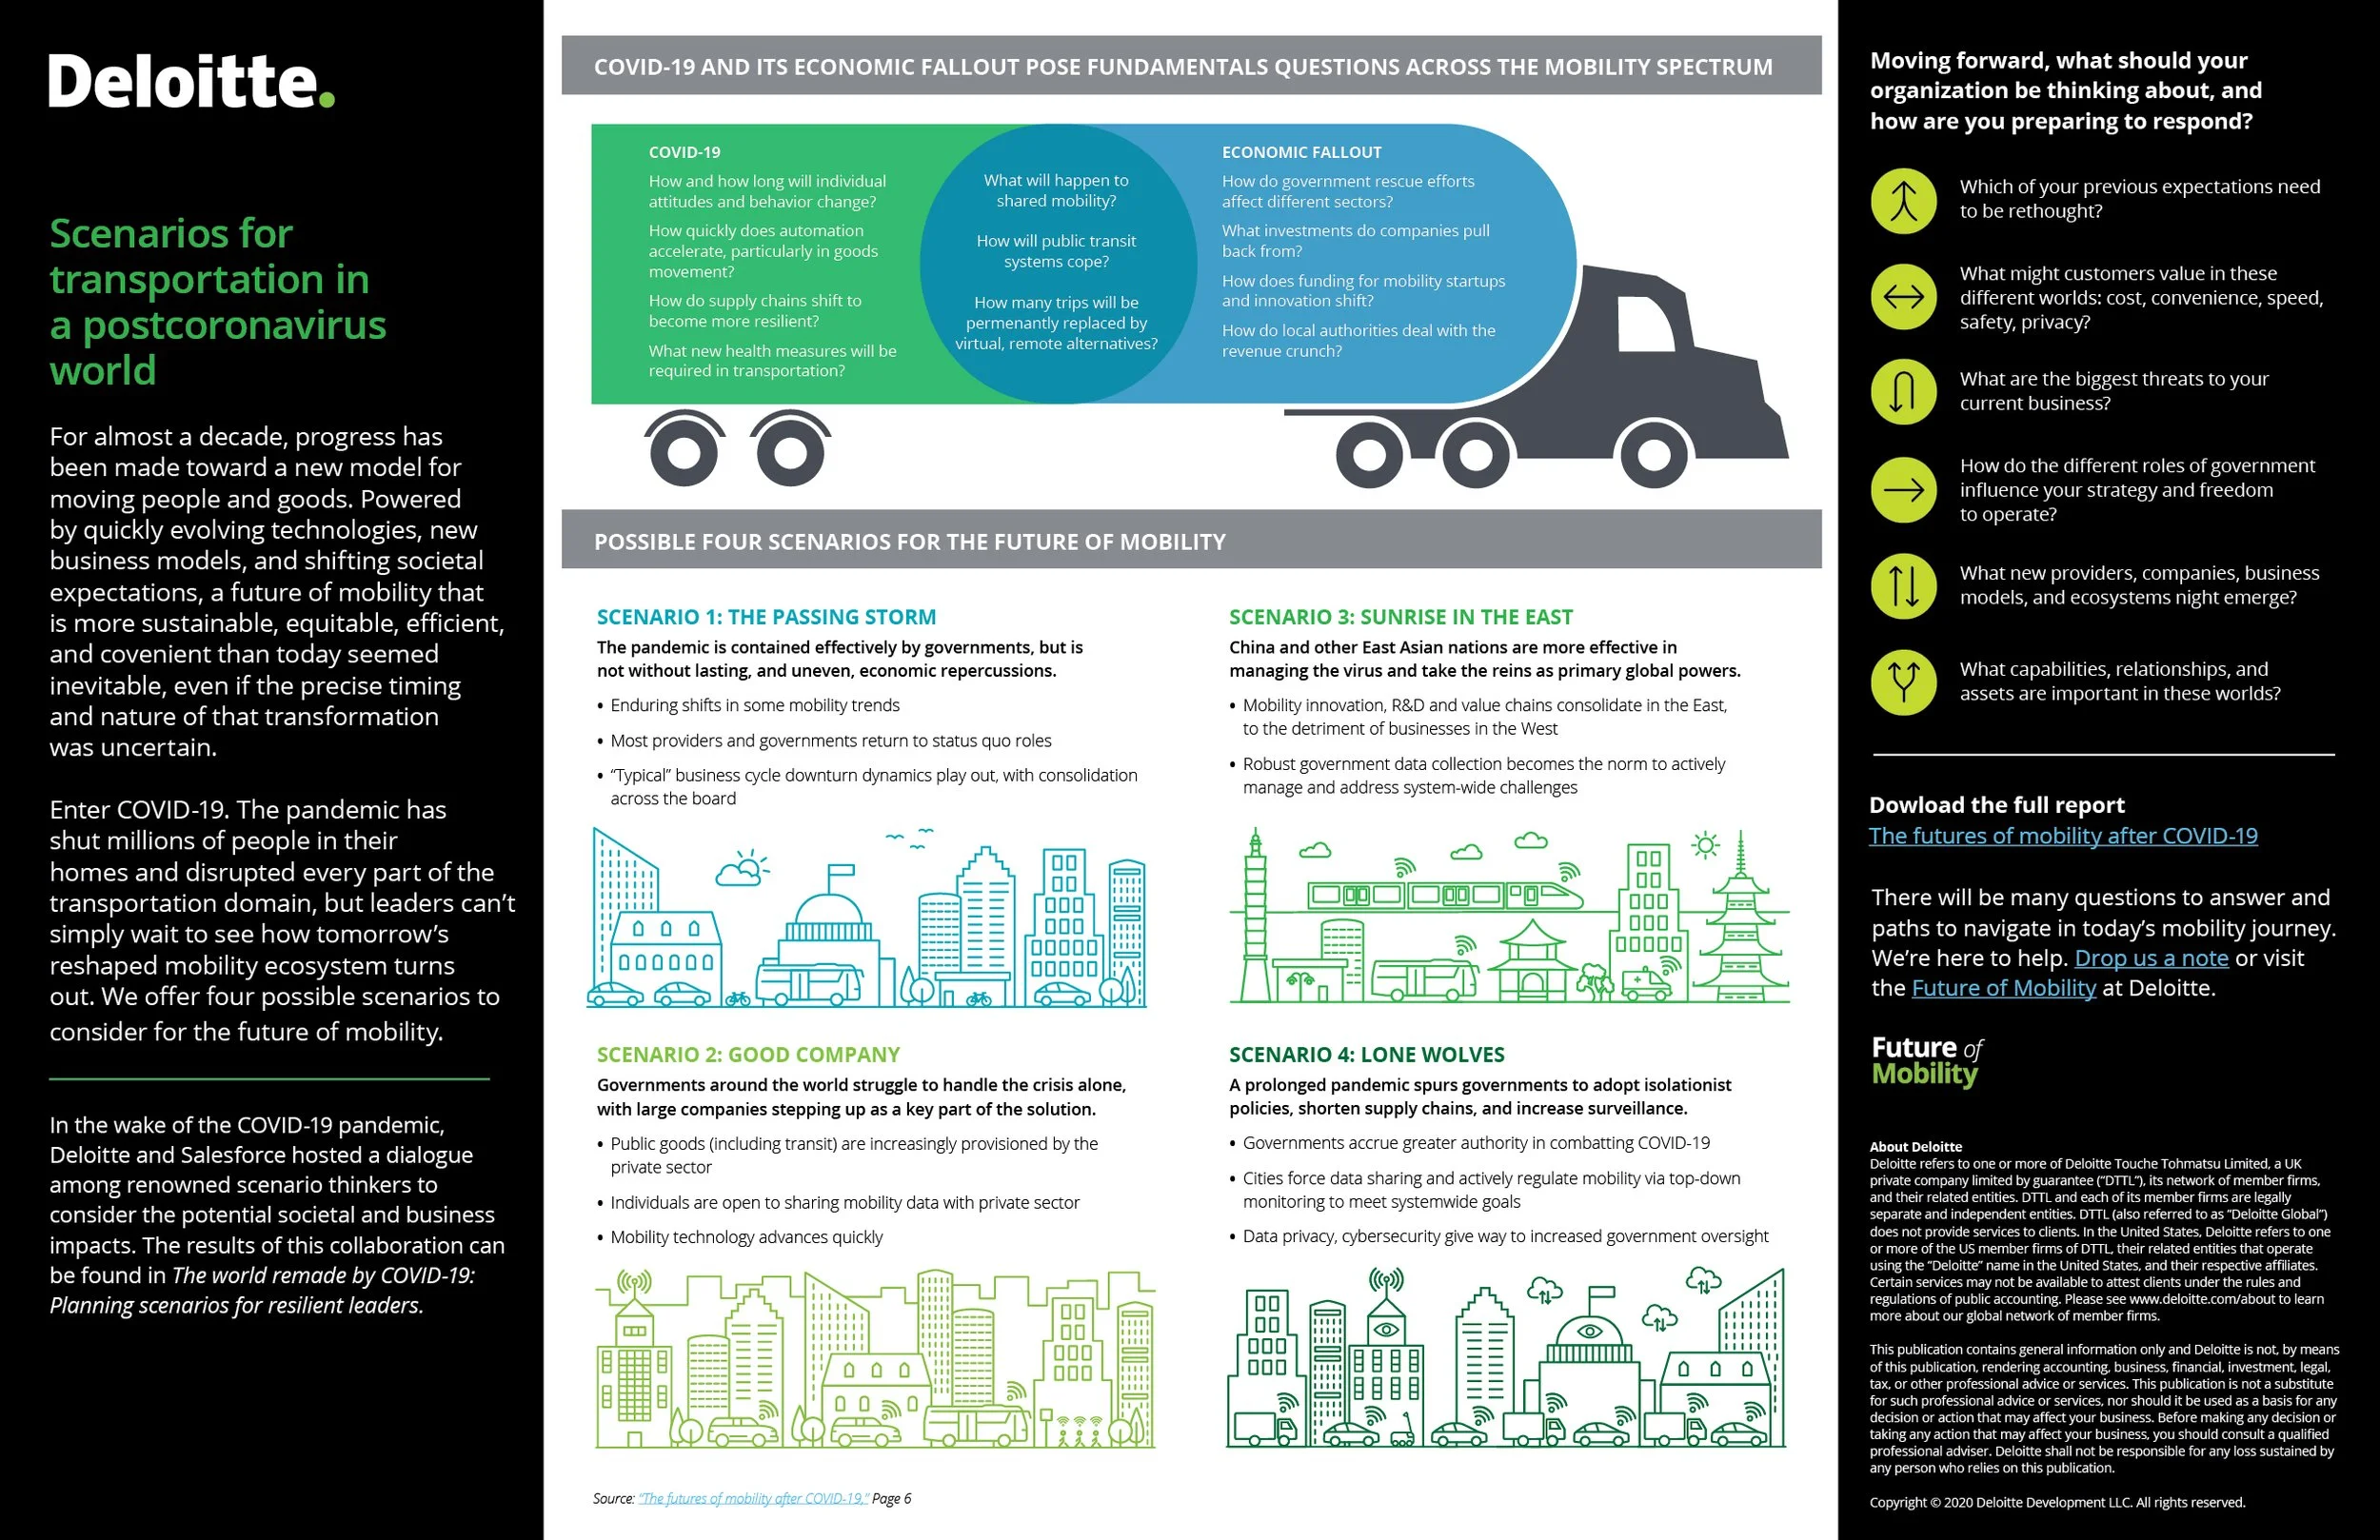
A collection of data visualizations created for Fireblocks and Deloitte. Each chart or infographic was designed to simplify complex information and reinforce the credibility of the content through clean, branded visuals.
Illustrator, Photoshop, InDesign

(Produced as freelance work for Lightboard.io, on behalf of their client Fireblocks.)